UK house price inflation business illustration
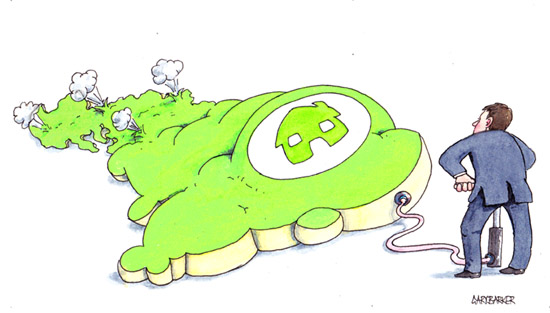
The cost of homes inflation continues to rise, but with great regional variations. London and the SE shows the highest rates while the North and Scotland the slowest.
Much of the fuel behind the rises is from people who buy to let, with the ONS revealing that in 2013, 4 out of 10 homes sold were paid for with cash. So prices continue to escalate, creating problems for just about everyone. Including the workers trying to meet extremely high rents to property developers with overheads prohibitting much needed development. Profits on property in London it has been stated have been the most profitable in the world recently, with earnings from it outstripping earnings from employment. There can be little wonder why demand and therefore costs have contnued to rise dramatically. Even a government minister resigned recently blaming cost of London rentals. In his opinion £28 thousand annual housing benefit provided by the tax payer to him was not enough to find him anywhere to live in the coty. Most would rightly scoff at that politicians attitude, but with rents for a single bedroom flat averaging £400 a week, it is easy to see how many ordinary people struggle to meet such high demands on their income where the cost of living is already extremely high.
The Southeast show the greatest price rise and this slows the further north we go and in much of the noth of England and in Scotland growth is very slow.

